How a flat earth 400 m running track would layout over actual San Jose CA Lynbrook High track
Here are two 400 meter track traces laid out over the Lynbrook High School track in San Jose, CA, one according to spherical earth surface geometry, and the other according to flat circular disk earth geometry, which is shifted slightly to the west (i.e. left) to make it easier to distinguish between the two for comparison purposes.
It is worth pointing out that there are two ways to compare spherical to flat geometry that should be distinguished to avoid confusion. Two blog posts ago where I first introduced walking a track and taking GPS data where I did this at Prospect High School, I showed how the actual GPS trace coincided accurately with the real map of the track and I will further note here that 5.58 km/12 = 465 m/lap is reasonably close to what would be expected for the 8th lane based on a quick web search for that information which gave 454 m/lap. And if you keep the trace the same but instead calculate how far that trace would have gone on a flat earth interpretation, you get almost 10% higher 6.01 km/12 = 501 m/lap. So to emphasize, this is keeping the trace the same and calculating the higher distance you would get with the flat earth geometry interpretation.
Instead in what I am illustrating in this blog post I am figuring out what the trace would need to be according to flat earth geometry in order to give the same distance as the actual track (spherical earth interpretation which is 400 m for lane 1). This is the reason why in this case, the flat earth trace shows up as smaller compared to the actual trace. So here we keep the distance travelled the same and get different traces for flat versus spherical, whereas in the previous case cited of 2 blog posts back of Prospect High School, the traces are kept the same so you then get different distances for flat versus spherical.
The Excel file with these traces is documented here.
SimSphFltLynbrookTrackLapVis Excel file
SimSphFltLynbrookTrackLapVis Excel file
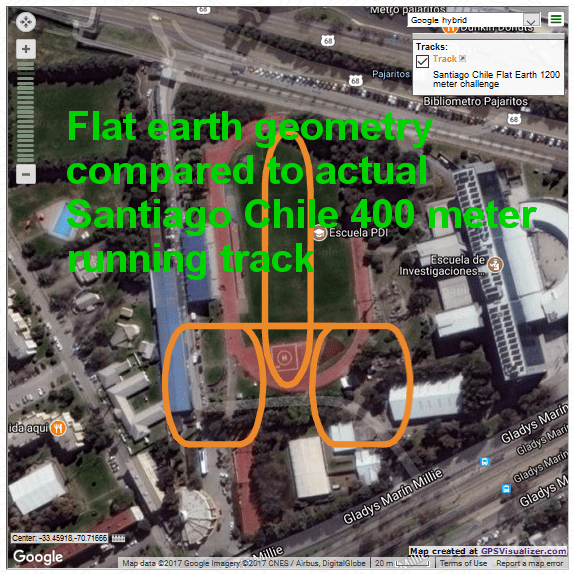
This illustrates how the distortion between flat and spherical geometry although not nearly as extreme as that shown in the previous blog post for Santiago Chile, is nevertheless significant and obvious to the eye here at the northern latitude of San Jose, CA.