Dioptra App Moon sighting vs Redshift 8 professional planetarium software prediction

The Dioptra App and the Redshift 8 planetarium software are promising tools which should have applications in doing experiments in the spherical earth vs flat earth controversy. Here’s some preliminary results testing these tools and a proposal for one way they could be used in a future experiment to test spherical vs flat earth models.

I remember getting the Redshift software for my Mac back in the mid 90s and successfully using it to predict and identify planets and stars and their positions in the night sky. There are quite a few brands of similar software on the market now, but without doing too much research I decided to go with the current premium version of Redshift now available for around $60.

So I took a sighting of the Moon with the Dioptra App on my Android Smart phone and then entered the same time and location parameters into Redshift for comparison.

Dioptra: Azimuth 102 deg magnetic & Altitude 38.4 deg

Redshift: Azimuth 114.9 deg true = 101.6 deg magnetic & Altitude 39.8 deg

This seems like pretty good agreement, but I will investigate further to determine if the results are within the experimental uncertainties expected for Dioptra and Redshift, or if there are any other explanations for the slight differences.

I plan to get a couple of friends, one over 900 miles north of me in Canada, and another almost 500 miles south of me in San Diego to take similar sightings of the Moon when high in the sky, and compare with my sightings, in order to determine if the data is consistent with the spherical earth model or a flat earth model. This should be a very simple and straightforward calculation to perform, taking into account the precise locations in terms of latitude and longitude for the sightings and also the precise times for the sightings.

I will report on those results once they are available, and I encourage others to do similar experiments and report on their results.


Stork Birtherism among God fearing Flat Earthers and Jet Fuel Deniers

A few months ago some God fearing Flat Earthers began discovering, gathering evidence, and reporting that jet aircraft actually do not need or use jet fuel as a power source to fly. The actual advanced technology used is hidden from the public in much the same way and for the same reasons that flat earth truth is also hidden from the public. It is just another example of Satan’s grand strategy and conspiracy to deceive us all into believing that jets require petroleum to fly and that petroleum came from rotting dead dinosaurs and other prehistoric life forms and that man evolved from lower life forms and that therefore God does not exist.

Some within this group are also venturing into another area of novel and hidden truth, stork birtherism. Many stork birthers are concluding that the idea that human babies come from and are the result of human beings engaging in sexual intercourse with each other is just as fake as the idea that jets need jet fuel to fly. God fearing Flat Earthers are the tip of the spear in casting out false beliefs and determining the real hidden truth about many things in these last days, including the truth about jet fuel and the latest revelation on how human babies come into this world, that they are delivered by storks, in the service of Almighty God.

The false belief that human babies come from human sexual intercourse is another of Satan’s great lies to convince people that they are no different than animals and that they evolved from animals and that therefore God does not exist. A recent convert to stork birtherism testified, “When I first heard flat earthers, jet fuel deniers, and stork birthers telling me that babies really come from storks, I thought it was ridiculous, until I tried to prove them wrong, and I couldn’t do it. So I became a stork birther. All those hideous videos you have seen of babies being born have either been faked with CGI or are the result of humans being possessed by Satan’s demons and having been enslaved by Satan’s human sex cult.”

[The flat earth movement not only puts another philosophical viewpoint on the table for examination, critique, and contrast, but also provides fabulous fodder for the follies.]

[Last March 2018 a friend of mine who is a flat earther referred me to a youtube video entitled “Passenger Airplanes Don’t Carry Fuel, technological achievement being hidden from public eyes” by the youtube channel “Enslaved By No Media” so I watched it. It appeared that this was a new concept catching on with some flat earthers. Shortly thereafter flat earth debunking airline pilot with youtube channel “wolfie6020” responded with a video “Don’t be ridiculous – of course Jet engines use liquid fuel.” So seeing these videos inspired me to respond with a Stork Birther satirical piece, which I originally shared as a comment on youtube, and also on Facebook. So here I finally got around to editing it a bit and creating a blog post out of it to hopefully share the satirical humor and laughs with more people.]


Flat earth geometry compared to actual San Jose CA 400 meter running track

How a flat earth 400 m running track would layout over actual San Jose CA Lynbrook High track

Here are two 400 meter track traces laid out over the Lynbrook High School track in San Jose, CA, one according to spherical earth surface geometry, and the other according to flat circular disk earth geometry, which is shifted slightly to the west (i.e. left) to make it easier to distinguish between the two for comparison purposes.

It is worth pointing out that there are two ways to compare spherical to flat geometry that should be distinguished to avoid confusion. Two blog posts ago where I first introduced walking a track and taking GPS data where I did this at Prospect High School, I showed how the actual GPS trace coincided accurately with the real map of the track and I will further note here that 5.58 km/12 = 465 m/lap is reasonably close to what would be expected for the 8th lane based on a quick web search for that information which gave 454 m/lap. And if you keep the trace the same but instead calculate how far that trace would have gone on a flat earth interpretation, you get almost 10% higher 6.01 km/12 = 501 m/lap. So to emphasize, this is keeping the trace the same and calculating the higher distance you would get with the flat earth geometry interpretation.

Instead in what I am illustrating in this blog post I am figuring out what the trace would need to be according to flat earth geometry in order to give the same distance as the actual track (spherical earth interpretation which is 400 m for lane 1). This is the reason why in this case, the flat earth trace shows up as smaller compared to the actual trace. So here we keep the distance travelled the same and get different traces for flat versus spherical, whereas in the previous case cited of 2 blog posts back of Prospect High School, the traces are kept the same so you then get different distances for flat versus spherical.

The Excel file with these traces is documented here.

SimSphFltLynbrookTrackLapVis      Excel file

SimSphFltLynbrookTrackLapVis      Excel file

This illustrates how the distortion between flat and spherical geometry although not nearly as extreme as that shown in the previous blog post for Santiago Chile, is nevertheless significant and obvious to the eye here at the northern latitude of San Jose, CA.

How 3 flat earth 400 m running tracks would layout over actual Santiago Chile Escuela PDI track

These are actual traces of what properly proportioned 400 m tracks laid out in Santiago Chile according to flat earth circular disk geometry would look like compared to an actual existing properly proportioned track there at Escuela PDI.

Three flat earth geometry tracings of properly proportioned 400 meter tracks overlaying actual 400 meter track in Santiago Chile, one tracing with long dimension running north south and two with long dimension running east west. The flat earth trace with the long dimension running north south exhibits the proportion similar to that of a cigar, whereas the two flat earth traces with long dimensions running east west exhibit the proportions of a pill box.

The Excel file with these traces is documented here.

ChileLeftRightShaftV2Vis      Excel file

ChileLeftRightShaftV2Vis      Excel file

This graphically illustrates the gross distortions in dimensions that occur in the southern lands when comparing imaginary flat earth geometry to real spherical earth geometry.

Running Tracks Worldwide Affirm Spherical Earth

Spherical Earth Affirming One Running Track At A Time

GPS+RunningTrack=FlatEarthDebunked

INTRODUCTION

In my previous blog post I mentioned looking at shorter trips and even walking routes that might give ample evidence to clearly affirm the spherical earth and debunk the flat earth.

And as I have tried a few different things, I have come upon a concept that will truly bring spherical earth affirming and flat earth debunking to the masses all over the world.

It turns out that no matter where you go throughout the world, wherever there is civilization, there are sports fields and running tracks, the tracks being nominally 400 meters around for one lap. It is true that there have been some different standards throughout the years, so tracks of differing dimensions will certainly be found. But anyone could easily measure for themselves the dimensions of their track for further verification if desired.

So no matter where most people live, they are most likely going to be able to find a nearby school with a track where they can go and do some walking (or running) around the track and do experiments with their GPS’s.

I have already done three different tracks at schools close to where I live. I will share the details of the one I just did yesterday.

PROSPECT HIGH TRACK WALK

I walked 12 laps in 1 hour 8 minutes 43 seconds. I stayed in the outermost lane the whole time, which in this case happened to be lane 8. I noted exactly where I started and after each lap would pause at that point for a few seconds just to mark that in the GPS data trace. As before, I used the tracking feature in GPS Essentials on my smartphone.

Once you finish the walk, you stop the tracking and then export the KML file. I then go to the website GPSVisualizer.com where I can upload the file and manipulate it in various ways, as I have explained in detail in previous posts. If you wish you can immediately have GPSVisualizer display the trace on a google map. I also convert it to a text file so I can import it into Excel where I do other calculations of my own, which again I have covered in detail in previous posts.

The beauty of using these running tracks is that they are pretty much standard throughout the world and wherever they are you can find them on google maps and verify that the traces of these tracks in terms of latitude and longitude make sense according to spherical earth surface geometry, but show major inconsistencies when trying to explain them according to flat earth circular disk surface geometry.

The inconsistencies become greater and greater the further south you go, so that in South America or Australia the inconsistencies are truly gross. Do you suppose that there may be some Olympic records that need to be adjusted according to flat earth theory? This is truly an important question to ponder. This is not unlike in an earlier blog post where I pointed out that the around the world flight non-stop without refueling was much more impressive and a greater world record according to flat earth theory.

So for my trip around the track 12 times I travelled 5.58 km at an average speed of 4.88 km/hr and these checked out with my own independent calculations in the Excel spreadsheet. For the flat earth surface geometry, the Excel spreadsheet showed that I travelled 6.01 km at an average speed of 5.25 km/hr in flat earth fiction land. The Excel spreadsheet also showed that the fictitious flat speed increased in a regular pulsating manner throughout the walk according to the regular changes in heading that going around a regular shaped track naturally produces.

As before I am sharing all my files through my Scribd account. You would at least need to register for a free Scribd account to be able to download the files, I believe.

20171210182010-38065-data      text file

text file

558488ProspectTrack8thLane      Excel file

Data in Excel file

558488ProspectTrack8thLaneSphFlt     Excel file

Spherical & Flat cases processed in one Excel file

I have also set up a special email address where anybody can email me GPS data files that they might like me to process for them. I have no idea how many might send me such files, so I cannot make any promises about processing all of them. Certainly those with some written explanation of what is included would rate higher in priority to process.

SphereAffirmer@att.net

WILL FLAT EARTH ADVOCATES INDEFINITELY CLAIM THEY HAVE NO FLAT EARTH MAP?

We simply cannot let the flat earth advocates continue to use their ruse of claiming they have no flat earth map to continue evading the clear deviations from reality of their theory. The problem is that different aspects of their theory together lead to conflicting conclusions. I covered this in a satirical manner in my earlier blog post on Tri-Location on the Flat Earth.

So let me just state the simplest part of their theory that should clearly establish a correspondence between coordinates on the spherical earth map versus their claimed flat earth map. Since they show the Sun completing a cycle in 1 day or 24 hours, the Sun would have to traverse 360 degrees of longitude in 24 hours. This would be the same whether you have a spherical earth or a flat circular disk shaped earth. So if you know the longitude of a city on the spherical earth its longitude should be exactly the same on the flat earth map. Similar arguments can be made that latitude should also be equivalent if the equator and tropics of Capricorn and Cancer are interpreted equivalently between spherical and flat models, as surely they must be or the flat earth theory makes absolutely no sense at all.

So if you were to go to a southern hemisphere place in Chile or Australia and layout a running track according to flat earth geometry of latitude and longitude its shape will be grossly different than the actual running track laid out according to real measurements and also in precise agreement with spherical earth surface geometry of latitude and longitude. I plan to show this graphically in a future post.


GPS + Odometer + Speedometer + Cruise Control = Spherical Earth Affirmed (San Jose to Berkeley)

GPS+Odometer+Speedometer+CruiseControl=SphericalEarthAffirmed(SanJoseToBerkeley)

INTRODUCTION

I recently got a very helpful suggestion from a person in Santiago, Chile, that expressing my work in metric units would be helpful to the international community, so this motivated me to travel metrically on a trip yesterday, as much as I was able, and to report the experimental results metrically as well.

In a nutshell, you track a car trip with your GPS and use cruise control to maintain intervals of constant speed as much as you can during the trip, noting the constant speeds you maintained as well as where on the trip you were able to do so. Once you get the GPS data you can analyze it and show that a spherical earth surface geometry interpretation of the data accurately gives the regions of constant speed and the overall trip distance in agreement with the car’s odometer and speedometer. On the other hand when you interpret the data according to flat circular disk geometry the intervals of constant speed do not show up as constant at all and the overall trip distance is much in error from the distance measured by the car’s odometer. I can already hear flat earth advocates saying something like the GPS data comes out right because it is based on spherical geometry, and indeed I agree that it is so based, but the car’s odometer and speedometer are independent of what theory of the earth’s surface you hold. The car should give accurate speeds and distances traveled whether you are on a flat earth or a spherical earth, or any other shape for that matter. The fact that the GPS data agrees with the independent data from the car’s odometer and speedometer is strong evidence that the spherical earth model is correct. The fact that the GPS data when interpreted according to flat circular disk geometry disagrees profoundly with the independent data from the car’s odometer and speedometer is strong evidence that the flat earth model is incorrect. I challenge all flat earth advocates and researchers to find a way to interpret the trip GPS data so as to show that it conforms to flat earth theory and also agrees with the independent data of the car’s odometer and speedometer.

The beauty of this experiment is that whenever someone does it they are going to get unique results that cannot possibly be predicted or planned for in advance. Where and at what speeds you are able to hold steady speeds with cruise control will vary with the road and traffic conditions. The path of the trip used will also impact the results in a unique way.

This type of experiment can easily be performed for a vast variety of trips all over the world and the data easily analyzed. I am going to share exactly how this can be done by showing how I did it for a trip from San Jose to Berkeley CA yesterday. All details are presented and the Excel files are made available to anyone through my Scribd account so they can see how it was done and use the spreadsheets to process the data from their own trips as well.

DETAILS FOR TRIP FROM SAN JOSE TO BERKELEY

I used the GPS in my smartphone, a Samsung Galaxy S4. I used the App GPS Essentials, where at the start of your trip you start tracking, and when you arrive at your destination you stop tracking. The trip file can then be exported as a KML file. From there you can process the data in various ways. I like to use the website GPSVisualizer.com for some things and Excel spreadsheet for many other things.

Car speedometer and odometer

It was easy to push a button to get my speedometer to read in km/h instead of mph, so that way I could easily see what my speed was in km/h during the trip. I was not sure how or if I could get the odometer to read in km, so I took the readings in miles and converted to km.

Trip from San Jose to Berkeley

91.1 km (56.6 miles) by odometer

Duration by my watch 1:10

Duration Start to Stop GPS 1:09:28

90.6 km 78.3 km/h ave speed 131 km/h top speed reported directly by GPS

From my smartphone I exported the trip KML file via email to my PC. The KML filename was Track-171126-105544. I then went to the website GPSVisualizer.com, where I uploaded the KML file and choose output format plain text table. I then clicked the link to download this text file back to my PC. I accepted the default filename 20171126171339-38065-data. I then opened the Excel spreadsheet application. My version happens to be from 2010. From within the Excel application, find the text file and open it. Either select to look at All Files or just Text Files to make sure you can see the correct text file to open. Once you open it, the Text Import Wizard comes up. The default settings are fine, so just click on Next, Next, and then Finish. At this point I like to do a Save As on the file, and save it as an Excel Workbook file, and give it a name that is more meaningful to me. So I gave it the name 906783SanJoseToBerkeley. I got the 906 from 90.6 km for the trip and 783 from 78.3 ave speed for the trip in km/h and added SanJoseToBerkeley to further help me identify this data. I will use this name with additional things added to it as more files are produced based on processing this data. I do not intend to make any further modifications to the Excel Workbook file 906783SanJoseToBerkeley so this can be kept as a record of this stage of the data processing procedure that could easily be returned to as needed. So then I will again do a Save As to the file and give it the name 906783SanJoseToBerkeleySph. This will be the file where some modifications will be made so it will do calculations according to spherical earth geometry. One other change I like to make at this point is to rename the data tab. So go to the lower left and right click on the data tab, that currently has the really long name that came from the GPSVisualizer when it created the text file from the KML file, and select rename. I like to rename it 906783-data. Once you do this be sure to save the file again. And then do another Save As and save it with the name 906783SanJoseToBerkeleyFlt. This will be the file where some modifications will be made so it will do calculations according to flat circular disk shaped earth geometry.

So let’s start by working on the 906783SanJoseToBerkeleyFlt file. If you have followed the directions exactly as above that file should already be open. If not, open it now. Also open the Excel file FltGeomMetricUnitsTemplate. This is the file where we are going to copy the section with the equations for calculation and paste them into file 906783SanJoseToBerkeleyFlt.

In the 906783SanJoseToBerkeleyFlt file select across from Column E to Column J, so that Columns E, F, G, H, I, and J are all selected. Be sure to select across the column headings so that the entire columns will end up being selected. Then Right-Click anywhere inside the selection and choose Insert. This then creates 6 empty columns from E to J, and moves the other stuff to the right so nothing is lost. In these 6 columns is where we are going to do some calculations on the data. So we are now going to get the equations from the FltGeomMetricUnitsTemplate file and copy and then paste into the new spreadsheet. So from FltGeomMetricUnitsTemplate select from E1 upper left to J12 lower right so that a rectangle of 12 cells down and 6 cells across are selected. Then Copy (Ctrl-C). Then go to the 906783SanJoseToBerkeleyFlt spreadsheet file and select cell E1 to define the upper left of where to Paste. Then Paste (Ctrl-V). At this point the equations need to be filled down to the extent of the data. Select cell E12 which defines the upper left. Scroll down to the very bottom of the data, in this case row 3416. Shift-Click on cell J3416. This will result in all cells bounded by E12 on the upper left to J3416 on the lower right to be selected. Then do a Fill Down (Ctrl-D). This then results in the equations being pasted all the way down so we get the calculations done that we wanted for the entire extent of the data. Two values can be read off of the spreadsheet at this point. If you go to cell G3416 the total distance of the trip according to flat earth interpretation is 96.2 km and to cell I3416 the average speed is 83.1 km/h also according to flat earth theory. Next we will create a plot of speed versus time. Column J is speed smoothed over several data points and is what I will use because it minimizes the natural scatter in the data for a better looking plot. If you want to use the point to point speed just use column H for speed instead. So select from cell B12 to B3416. The way I like to do this is first select cell B12, then scroll all the way down and shift-click on cell B3416. Next we want to add to the selection cells J12 to J3416. The way I like to do this is first Ctrl-click on cell J12 and then scroll down and shift-click on cell J3416. Now that we have selected two separate columns, one defined by cells B12 to B3416, and the other defined by cells J12 to J3416, we can create a plot of this speed versus time data. So go to Insert, select Scatter, and then Scatter with straight lines is the one I like. This puts the plot in front of the spreadsheet table. I like to make it separate with its own tab. So right click in the right area of the plot and chose Move. Then click the button and accept the default name of Chart1 or give it your own name. I like to call it SpeedVsTimeSm, for speed versus time smoothed. This then is the speed versus time plot based on the flat earth interpretation of the data. This will eventually be compared with the equivalent plot based on the spherical earth interpretation of the data. What we will find is that the intervals where the speed was held constant with cruise control show up clearly and distinctly constant on the spherical earth interpretation, but with much variability on the flat earth interpretation.

So basically to get the equivalent calculations for the spherical earth surface model, repeat everything above, but instead using SphGeomMetricUnitsTemplate and working on file 906783SanJoseToBerkeleySph.

Once you do this you will get the results that I have summarized below.

Trip from San Jose to Berkeley

91.1 km (56.6 miles) by odometer

Duration by watch 1:10

Duration Start to Stop GPS 1:09:28

90.6 km 78.3 km/h ave speed 131 km/h top speed by GPS

90.67 km 78.32 km/h ave speed confirmed by calculations in Sph Excel spreadsheet

Speed versus Time plot for spherical model shows clear agreement with speedometer data

Speed versus Time plot for flat model shows large deviations from speedometer data

96.2 km 83.1 km/h ave speed by calculations in Flt Excel spreadsheet Inconsistent with odometer data

Spherical Earth model: Affirmed

Flat Earth model: Large deviations from reality

If I am able to display the Speed versus Time graphs I will show them here. If not they can be seen at the Scribd links.

Speed versus Time according to Flat theory

Speed versus Time according to Flat theory

Speed versus Time according to Spherical theory

Speed versus Time according to Spherical theory

I have made these files available to the public through my Scribd account.

20171126171339-38065-data    Text file

20171126171339-38065-data    Text file

906783SanJoseToBerkeley           Excel file

906783SanJoseToBerkeley           Excel file

906783SanJoseToBerkeleyFlt        Excel file

906783SanJoseToBerkeleyFlt        Excel file

906783SanJoseToBerkeleySph       Excel file

906783SanJoseToBerkeleySph       Excel file

FltGeomMetricUnitsTemplate         Excel file

FltGeomMetricUnitsTemplate         Excel file

SphGeomMetricUnitsTemplate         Excel file

SphGeomMetricUnitsTemplate        Excel file

Anybody should be able to see the files by just going to the links. The graphs of Speed versus Time for both the spherical and flat cases should be able to be seen this way. To download the files you need a Scribd account, and a regular account should be free to set up.

I was not able to make the KML file Track-171126-105544 available through Scribd because it is not a supported file type.

I encourage people all over the world to take their own data and process it in this manner and report their results. Let me know if you have any questions. Comments are welcome. Thank you.

How Anyone can be a Hands-On Spherical Earth Affirmer – A Global Call to Action

VERY STRONG EXPERIMENTAL EVIDENCE AFFIRMING THE SPHERICITY OF THE EARTH

A fairly common story from flat earth advocates is that they started out thinking that the earth being flat was a ridiculous idea, so they started trying to prove that the earth was a sphere, and since they were not able to do that as easily as they thought they should, at some point they gave up and concluded that the earth must therefore be flat. I know there is more to their overall spiel, but this is a significant part of what a lot of them say.

Well, I have gotten to the point where I feel that I have proved that the earth is a sphere, at least to my own personal and professional satisfaction. That does not mean that I have refuted every single flat earth argument, nor have I done experiments in all possible areas that might bear upon the issue. But I have done enough experiments and analysis that I do feel at peace knowing with confidence of the fact that the earth is a sphere. And I want to share with people all over the world how they can do simple experiments right where they live to verify for themselves that the earth is a sphere.

I welcome anyone to comment on this presentation as well as any of my other blog posts. Flat earth advocates, I challenge you to show me where I have made any errors in math, science, or logic.

SURFACE OF A SPHERICAL EARTH VS THAT OF A FLAT CIRCULAR DISK EARTH – CONCLUSIONS FROM INDISPUTABLE DIFFERENCES IN GEOMETRICAL PROPERTIES

The basic idea is that the geometrical properties of the surface of a sphere are very different than the geometrical properties of the surface of a flat circular disk. The spherical earth is laid out in terms of a defined grid of latitude and longitude. Any point on the surface of the earth can be uniquely specified by its coordinates of latitude and longitude. The azimuthal equidistant map is in reality just a projection of the spherical earth onto a circular disk. So the defined grid on this map of latitude and longitude is equivalent to that of the spherical earth map, with one exception. The nature of the projection causes the south pole, a point on the spherical surface of the earth, to project into a circle, the outer boundary of the azimuthal equidistant map. Flat earth advocates often present the azimuthal equidistant map as a flat earth map with the north pole at the center of the circular disk and the south “pole” not as a pole or single point, but as an outer boundary of the commonly known earth. But when people point out the obvious problems with this map in terms of giving unrealistic distances between points on the map, flat earth advocates often say that they know there are problems, and they are still working on getting an accurate flat earth map.

The azimuthal equidistant map is an accurate map of the spherical earth, where the map happens to be flat. But it must be interpreted properly to be useful. For example, any straight line distances between points that run exactly north south will scale properly. But any straight line distances between points that deviate at all from running north south will not scale properly. This is why when one tries to interpret the azimuthal equidistant map as a map of an actual flat earth, in which case the distances should scale properly in any and all directions, a distance between Perth Australia and Sydney Australia of around 5000 miles is determined when in reality we know the distance between these cities to be around 2000 miles.

Since the earth is really a sphere, there is no way that flat earth advocates will ever be able to tell you where anything is on the flat earth map in a way that all the distances will scale properly with reality. It seems clear that they maintain that the north pole is at the center of the circular disk and that the south “pole” is at the outer ring or boundary, and the equator is a circle half way between the north pole and the southern ring, but once they put that stuff on the map, why can’t they put the rest of the stuff on the map? The more that they try to put on the flat earth map, the more it exposes the flaws in this flat earth theory.

Even locating the equator exposes a fatal contradiction in their flat earth model.  For the real distance around the equator on the real spherical earth is around 25,000 miles whereas the distance around the flat earth map’s equator is around 39,000 miles.

This and other implications of Flat Earth Science poses many contradictions with our world’s sophisticated system of weights and measures, geography, navigation, science, and commerce, that has taken civilization hundreds if not thousands of years to perfect to the very high level of precision and accuracy that has provided many benefits to humanity, but unfortunately has also been used in destructive and evil endeavors.

Countless examples could be found, but here I offer just one. In 1986 the aircraft Voyager set a record of flying around the world non-stop without having to re-fuel. They stayed pretty close to the equator for most of the trip except for when they took off from Edwards AFB in California and headed towards Hawaii, and upon return came up through Mexico back to their starting point in California. So the actual distance traveled by this plane was around 25,000 miles, but if the same route was done on a flat earth map the distance would have been over 34,000 miles. So their average speed reported as around 115 mph should have been over 156 mph. But wouldn’t the pilots have noticed this on their airplane’s airspeed indicator? So according to flat earth science this record needs to be revised, for it is a much more impressive accomplishment on the flat earth than on the spherical earth. Just think of the many other world records that will now need to be revised due to the proper application of flat earth science.

DO YOUR OWN TESTS AND YOU TOO CAN BECOME A HANDS-ON SPHERICAL EARTH AFFIRMER

But anyone can do their own simple experiments right where they live to verify that the readings conform to reality on the spherical earth model, but not on the flat earth model. I have done this for where I live in San Jose, California.

Basically what you do is drive your car a few miles between defined coordinate points on a road that runs west east and measure the distance with your car’s odometer. And then you do the same for a road that runs south north. From this data you can calculate the gradients, the west east gradient and the south north gradient, in terms of miles traveled per degree of longitude and miles traveled per degree of latitude, respectively.

Here’s the applicable equations that tell you what these gradients should be wherever you are on the spherical earth or the flat earth.

Spherical

Distance traveled/degree of longitude = (2*PI*Re*COS(latitude*(PI/180)))/360

Distance traveled/degree of latitude = (2*PI*Re)/360

Flat

Distance traveled/degree of longitude = ((90-latitude)/(90*360))*PI^2*Re

Distance traveled/degree of latitude = (2*PI*Re)/360

Where Re is the average radius of the spherical earth = 3958.755 miles, PI = 3.14159, and latitude is in degrees as usual.

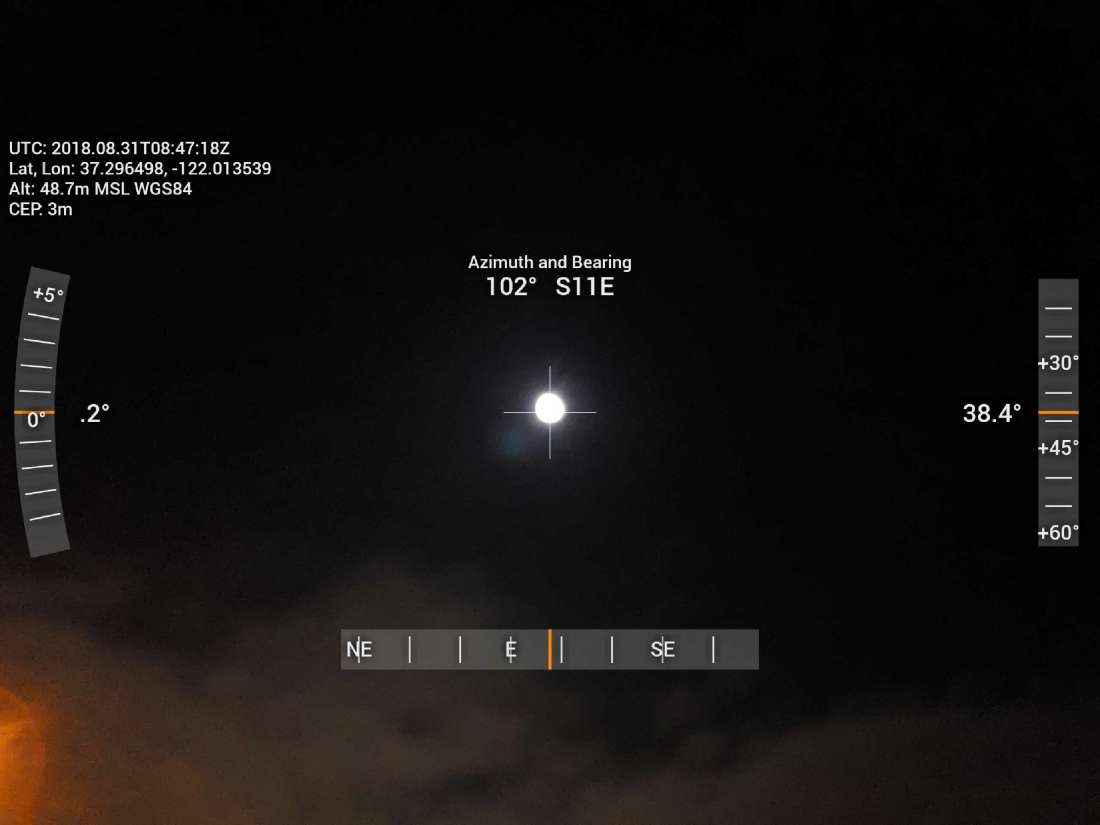
However you got your coordinates of latitude and longitude for the points you traveled between, if you don’t trust these values and want to do some more checking on this, you can do the following. Go to any of several online sun calculators that will give you the time of solar noon where you are and also at some other place east or west of you and then verify that you get a difference in time of 4 minutes per degree of longitude. This is data that flat earth scientists should find very hard to dispute, because anyone can measure the difference in time for solar noon between two places. The data will be the same for all, no matter what their views on the shape of the earth are. So this should allow you to see if your longitude values you used for the points to determine your west east gradient make sense for where you live. For a check on latitude values you can check the sun angle for where you are at solar noon with the sun angle at a place either north or south of you and see if this makes sense. I am not going to go into the details of this here, as there is less potential for dispute here, because this is a case where the flat earth model and the spherical earth model happen to agree with each other. That is, on the south north gradient of miles traveled per degree of latitude, the value is a constant of 69.0933 miles per degree of latitude no matter where you are on either the spherical earth map or the flat earth map.

So basically what I did for where I live in San Jose is that back on the equinox of September 23, 2017 I verified the sun’s angle at solar noon and determined that it was indeed consistent with my latitude here. I took odometer readings with my car between defined points on both a west east road and a south north road, and calculated the gradients and found them to be consistent with what the spherical earth model would predict.

So based on the results I got I would have to be around 500 miles further north on a flat earth map in order for the results to be consistent with the flat earth model, somewhere around Sisters, Oregon on the spherical earth map.

If where you are, it is difficult to find roads that run close to south north or west east, just find the closest to that ideal and then correct the odometer reading from your car by multiplying by the cosine of the angle of deviation from the ideal path to the actual path to get the correct distance to use for calculating the gradients.

DETAILS OF THE DATA AND CALCULATIONS THAT I DID

Traveling from west to east was from 37.322909, -122.010161 to 37.323274, -121.937518.  The odometer in my car said I had gone 4.1 miles.  Notice that the latitudes of the two points are within 3 significant figures to the right of the decimal point to each other which is sufficient to establish that for practical purposes the points are east-west of each other.  So calculating miles traveled per degree longitude = 4.1/(122.010161-121.937518) = 56.4 miles/degree longitude.  Notice that since the odometer reading of 4.1 has only 2 significant figures, the result is only good to 2 significant figures, so it could be reported as 56  +/- 1  miles/degree longitude.  Based on the spherical earth model the calculation is (2*PI*Rearth*COS(latitude*(PI/180)))/360 = 54.95 miles/degree longitude.  So the experimentally determined value of 56  +/-1  is consistent with the spherical earth theoretical value of 54.95 within experimental uncertainty.

Traveling from south to north was from 37.321039, -122.014123 to 37.362467, -122.014167.  The odometer in my car said I had gone 2.9 miles.  Notice that the longitudes of the two points are within 3 significant figures to the right of the decimal point to each other which is sufficient to establish that for practical purposes the points are north-south of each other.  So calculating miles traveled per degree latitude = 2.9/(37.362467-37.321039) = 70.0 miles/degree latitude.  Notice that since the odometer reading of 2.9 has only 2 significant figures, the result is only good to 2 significant figures, so it could be reported as 70  +/- 1  miles/degree latitude.  Based on the spherical earth model the calculation is (2*PI*Rearth)/360 = 69.1 miles/degree latitude.  So the experimentally determined value of 70  +/-1  is consistent with both the spherical and flat earth theoretical values, which are the same, of 69.1 within experimental uncertainty

It is worth noting that in both cases above the experimentally determined number was a little greater than the theoretically calculated number.  This could be due to the deviation of the actual path driven from a perfectly straight line.

According the flat earth geometry, you would need to be at about latitude 44.5 degrees to get a west east gradient of 54.9 miles per degree of longitude. The calculation is grad= ((90-latitude)/(90*360))*PI^2*Re = ((90-44.5)/(90*360))*3.14159^2*3958.755 = 54.9 miles per degree of longitude. So you would need to be at 44.5 degrees latitude on the flat earth map, where at this latitude on the spherical earth map you would be up right around Sisters, Oregon, if I keep the longitude the same as San Jose.

A CALL TO ACTION

Others all over the world could do similar measurements and calculations as I have done and determine if the results they get are consistent with the spherical earth map.

Remarkably, on the spherical earth the maximum west east gradient occurs at the equator with a value of 69.0933. But on the flat earth map you have to go up to 32.7 degrees latitude to get this same gradient, which would be right around the latitude of Yuma, Arizona on the spherical earth map. On the flat earth map, the gradient is 108.5 at the equator, and once you get down to the southern ring, the gradient is 217. In contrast, at the south pole of the spherical map the gradient is zero.

Ask any flat earth advocate to name one city on the earth where the west east gradient is greater than 100 miles per degree of longitude. There should be many according to flat earth theory, but they cannot even name one.

So much more can be said and further experiments done on this.

Flat earth advocates claim that GPS is not valid and it is not based on satellites, which they claim do not exist. Well, if you start doing experiments with GPS you will find that it is extremely accurate and also its results, when combined and compared with independent and complementary data, are consistent with the reality of a spherical earth.

Flat earth advocates will say something like, GPS is based on spherical earth geometry so that is why it works. But there is a problem with their logic. They are essentially saying that the spherical earth map is a projection of the real flat earth onto a sphere. Well, if that is the case, why can’t they provide a flat earth map that works giving us where things are on that map? They can’t. It is impossible. GPS can easily be shown to be consistent with a real spherical earth and its map when GPS experiments are done where trips are tracked with GPS combined with independent distance measurement methods, such as with a car’s odometer.

I am already working on these things and will report on the results in future posts.

I encourage others all over this Grand Spherical Earth that we share and live on to do their own similar experiments and report on their results also.

Where on earth on The Flat Earth will the Flat Earth International Conference 2017 be held?

I pose this question to all within the current Flat Earth Theory advocacy movement, especially those who will be presenting at and attending the upcoming Flat Earth International Conference to be held November 9-10, 2017 in Raleigh, North Carolina.  I have already posed this same question to three of the speakers to be at the conference, in private communications, Rob Skiba and Mark Sargent (myself having been a purchaser and reader of their books), and also, Bob Knodel, but so far, have gotten no responses.

Can you inform the World Community of the coordinates of latitude and longitude for Raleigh, NC on the flat earth (in particular 201 Harrison Oaks Blvd, Cary, NC 27513), the location of the upcoming Flat Earth International Conference?  It would seem very odd indeed if flat earth advocates could not even tell the world where on the flat earth they are holding their flat earth conference.  I realize that flat earth theory is quite primitive at this point, but could you at least determine where on the flat earth map Raleigh, NC is within a 100 mile radius?  This seems like a very legitimate and fair question.

The coordinates on the spherical earth map for 201 Harrison Oaks Blvd, Cary, NC are 35.833, -78.772.

The World Community eagerly awaits The Flat Earth Movement’s answer to this very simple and important question.

Former NASA engineer makes major Flat Earth Theory discovery today October 17, 2017

It was discovered today by T. Mark Hightower, formerly an engineer with NASA but now retired and actively engaged in flat earth theory research, that current flat earth theory implies that while one is present in one place on the flat earth they are actually at the same time also in two other far away distinct locations on the flat earth.  (It may alternatively be possible that no one is actually present anywhere on the flat earth, but flat earth researchers consider this the null case where further study is not merited.)  The ramifications of this discovery are far reaching for the fledgling resurgence of flat earth research in the recent past as many were hoping that flat earth theory would be a tremendous simplification of our understanding of God’s fish bowl in which we live, but now it appears that flat earth theory may be just as complex, enigmatic, and paradoxical, as Einstein’s theories of relativity, quantum mechanics, string theory, and multiverse theory, where our cozy fishbowl with the ceiling of a planetarium was erroneously viewed as being the result of a big bang billions of years ago resulting in an expansive and seemingly infinite multidimensional space time continuum  containing countless galaxies, stars, black holes, planets, moons, asteroids, hemorrhoids, comets, explosive diarrhea, and aliens.  Practical applications of these new discoveries are firmaments away, but some day it is hoped that the average Flat Earthian will be able to transport him or herself to other places within the flat earth fishbowl instantly and at will, thereby saving tremendous amounts of energy, and also making it unnecessary for NASA to continue faking the launching of satellites and other spacecraft, saving even more money and energy and improving NASA’s public image on Youtube, Facebook, and Google, and also making it much less likely that it will be necessary to target NASA employees in a future false flag incident possibly made to appear as if it were carried out by a lone nut Flat Earthian.  Rigorous documentation of this discovery will be given in the near future (perhaps in a week or two) for peer review by fellow flat earth researchers, as well as conventional scientists and others.

Answering questions on vacuum, space, rockets, and space travel

On about September 21, 2017 I received via email some questions/comments related to vacuum and how rockets and spacecraft are able to operate in space.  I replied within about 1 day and my responses are presented below slightly edited.

QUESTIONS/COMMENTS AS PRESENTED

How can anything be propagated through space if it is a vacuum, nothing?

If space is a vacuum then what does the rocket push off of?

How does the rocket maintain its heading and not spin out of control if there is no air to stabilize off of?

Space travel believers will say that they use special propellant that when ejected out of the thruster nozzle has an equal and opposite reaction.

If that’s the case then wouldn’t the thrusters on let’s say the space shuttle when maneuvering to the ISS have to eject the special propellant faster than 17,500MPH which is the speed they are traveling?

All tests show that rockets don’t work in a vacuum.

T MARK HIGHTOWER’S RESPONSE

I am going to do the best I can to answer these questions as quickly as possible off the top of my head without consulting any sources of information beyond what I currently know.  These are all good questions and certainly more could be learned by studying these things more.

ON VACUUM

First regarding the question of vacuum, I think that even in space there is not a complete vacuum in the sense that you could find a cubic mile of space that does not contain at least one atom or atomic nuclei.

But even if you could imagine a cubic mile of space without even one atom in it, I believe that other physical phenomena could take place in this space, such as the transmission of light or other electromagnetic waves, and other things possibly (I would have to research this more).

Even if you could have completely empty space, it becomes kind of a philosophical question of what is “nothing.”  I think the view of physics is that even if you could have completely empty space, that is not nothing, but instead a part of reality, known as the space time continuum in physics.  I think this view that even empty space would not be nothing goes back to early philosophers even before Christ.  I would have to double check on this.

I know we have plenty of examples here on earth of physical phenomena taking place in a high vacuum, but we really cannot create a perfect and complete vacuum.

So before we had transistors, we had vacuum tubes.  These accomplished the same sort of electrical tasks that eventually became possible to do with transistors.  When multiple transistors integrated into an electrical circuit were eventually created on a silicon chip, we got computers and relatively shortly thereafter we got computers that ordinary people could buy and use.  But realize that there were digital computers even before transistors, and these computers used vacuum tubes.

But of course, the more common use of vacuum tubes initially was in radio and then eventually television.  So there is a lot going on within the vacuum of a vacuum tube, such as the flow of electrons in the vacuum, and I am remembering how vacuum tubes need a source of heat to operate, and that is done with the filament, which is basically like a separate electrical circuit within the vacuum tube that functions just like a conventional incandescent light bulb.  Also, the screens of the original televisions were cathode ray tubes which were themselves giant vacuum tubes where a fast moving electron beam is used to create the television picture.

Now moving on to the other space questions.  I will paste the questions/comments posed and intersperse my answers/comments.

Question: If space is a vacuum then what does the rocket push off of?

Answer: It pushes off from the mass of propellant reaction products that it expels at high velocity.  I answered this more completely in a separate blog post dated September 20, 2017.

Question: How does the rocket maintain its heading and not spin out of control if there is no air to stabilize off of?

Answer: A physical solid object in space would remain in motion unless acted upon by an external force.  If we were to imagine that it were far enough out in space such that there were no significant gravitational forces acting upon it, then it would continue moving in a straight line for example.  I am using moving in a straight line, because if I said it was at rest, it would raise the question of what is it at rest with respect to, so linear motion is easier to imagine for this thought experiment.  This would be conservation of linear momentum.  The center of mass of the object would continue to move in a straight line.  But if the object had a spin or rotation to it, that spin would also continue indefinitely, unless acted upon by a force to change the rotation.  Just to complicate the example a little for illustration, let’s say it was a spacecraft traveling with a couple of astronauts in it, and the spacecraft was of a long cylindrical shape with one astronaut at one end and the other at the other end, and the spacecraft was tumbling (spinning) end over end.  If the astronauts were to move from the ends to the middle of the spacecraft the rate of the spacecraft’s tumbling would increase.  This would be due to conservation of angular momentum.  By the way, an example of conservation of angular momentum that most people on earth are familiar with is when an ice skater gets to spinning with their arms extended outwards and perhaps even a leg extending outward, and then draws their arms inward as well as their leg, and then they end up spinning noticeably faster.

Question: Space travel believers will say that they use special propellant that when ejected out of the thruster nozzle has an equal and opposite reaction.

Answer: I would have to research this for details, but I can say this.  Once you are in space, to make changes or corrections in either linear motion or spinning motion you are going to need more than one thruster pointed in different directions in order to achieve any change that you might want.  Maybe it could be done with just one thruster if you had the ability to change the direction that the thruster points from the spacecraft.  But also, for in space use, the corrections you make are usually going to be relatively small, so you want your thruster to be easy to turn on and off.  So you wouldn’t want to be burning rocket fuel and oxygen for example.  This is where your special propellants come in.  For a propellant to work all it needs to be able to do is expel a mass at a certain velocity, the higher the better, because then you get more effect for the mass that you use.

Question: If that’s the case then wouldn’t the thrusters on let’s say the space shuttle when maneuvering to the ISS have to eject the special propellant faster than 17,500MPH which is the speed they are traveling?

Answer: The unreacted unejected propellant is already going at the same speed as the spacecraft before it is ejected.  To cause a change in the motion of the spacecraft it only has to be ejected at some velocity with respect to the velocity of the spacecraft.  A thorough discussion follows.

Presumably in this example the spacecraft is orbiting the earth in a stable orbit at whatever distance from the earth that would be necessary for orbiting at 17,500 mph.  This could easily be calculated but I am not going to do that now.  I just know from having heard these orbital speeds mentioned before that this would be at a distance from the earth where you would have a very high vacuum, meaning essentially no “air” drag on the vehicle.  This would mean that the spacecraft would keep moving in this orbit unless acted upon by an external force.

The reason it is not moving in a straight line is that gravity is continually exerting a force upon it in a direction perpendicular to its velocity.  This is known as centripetal force and it causes the spacecraft to be continually curving toward the earth.  But it is going fast enough that the curving is the right amount to keep the spacecraft circling or orbiting the earth.

If you wanted to cause the spacecraft to re-enter the atmosphere, all you would need to do is fire a thruster in the opposite direction to the velocity of the spacecraft.  Note that the propellant used would already be travelling at the speed of the spacecraft before it is reacted and released, so it is ejected at high velocity with respect to the spacecraft’s velocity.  In so doing, if it is fired long enough to decrease the velocity enough, and this could all be calculated ahead of time based on the performance characteristics of the thrusters, the slower speed will result in the force of gravity causing it to curve more than the curve required for the orbit, so the spacecraft will start to travel to lower altitudes and eventually start entering the atmosphere.  I have never felt the need to look into the numerical aspects of all of this, but it might be interesting to gather all of this information to see if it all makes sense.  But I suppose, if it is all fake, they could have just made it all calculate out correctly to deceive us all.

MORE ELABORATION ON PHYSICS

Just a little note about how physics works for the equation F=ma in order to help better understand what centripetal force is.  (I am reflecting upon when I first learned about this equation, taking physics for the first time in high school 44 years ago, where I learned how this equation explains why car accidents can kill you, but that’s another story.)  In reality this equation is a vector equation.  A vector has both magnitude and direction.  F is the force vector with both its magnitude and direction.  a is the acceleration vector also with both magnitude and direction.  Acceleration is also by definition the time derivation of the velocity vector.  So in words, F(magnitude&direction) = mass x a(magnitude & direction) or

F(magnitude&direction) = mass x (change in v/change in t)

Where v is the velocity vector also with magnitude and direction.

So if you were in a drag racer, and you got the green light, and you take off, you would feel yourself being pushed from behind by the back of the seat as the car accelerates in a straight line with you in it.  Your velocity would be changing in magnitude (increasing) while its direction stays the same, straight ahead.

Now if you were traveling in a car at a constant speed and in a straight line, but then you put the car into a turn of a certain radius but at constant speed, you would feel the side of the car pushing against you in the direction that the car is turning.  In this case you are experiencing a constant acceleration, that is, a change in the velocity vector with respect to time, but the velocity vector is changing in direction but not speed or magnitude.  So in this turn the centripetal force is the force being exerted by the ground on the tires of the car perpendicular to its forward motion in order to cause it to turn (with you inside), which is a constant acceleration maneuver.  To make it a little more personal for you in the car, the side of the car is pushing against you causing you to turn, a centripetal force causing the centripetal acceleration of you.

Most people are familiar with the term centrifugal force.  If you are sitting in the turning car, from your point of view as being in the car, known in physics as a rotating reference frame point of view, you feel a force throwing you to the outside of the car, that is indistinguishable from a gravity force from your point of view from inside the car.  This reminds me of the space station in 2001 A Space Odyssey, where it is spinning so as to create an artificial gravity, so the person is able to run around it as if they were running on a surface with a gravitational attraction.

Comment: All tests show that rockets don’t work in a vacuum.

Answer: I would like to review these tests so I can comment upon them.